Predicting GitHub Cron Delays
Data driven insights into the uncertainty of CI/CD schedules
If you use GitHub Actions, you’ve probably noticed that cron jobs don’t always run exactly on schedule. GitHub mentions it in their documentation:
The schedule event can be delayed during periods of high loads of GitHub Actions workflow runs.
But how bad is it really? When is your job likely to start late, and by how much? That’s what the GitHub Cron Drift dashboard is here for.
This Grafana dashboard tracks the difference between when a cron job is scheduled to run and when it actually starts on GitHub-hosted runners. You can use it to spot patterns, understand typical delays throughout the day, and plan your workflows more realistically.
What you’ll find
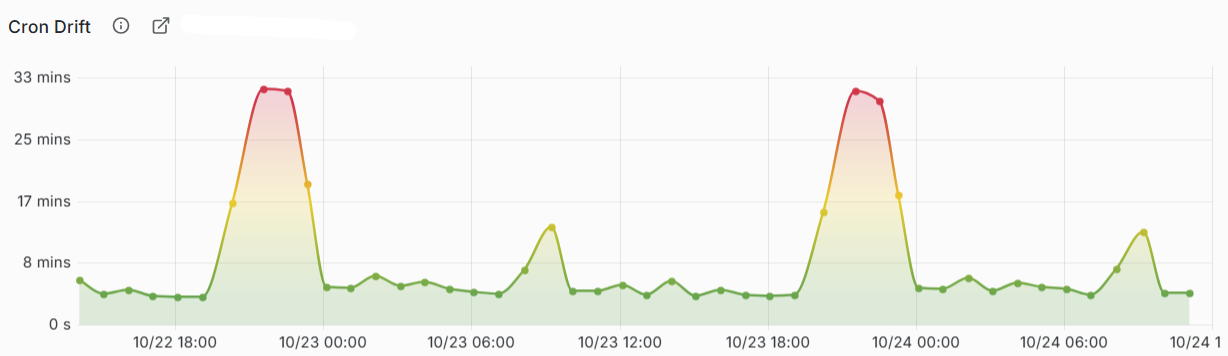
Cron Drift Over Time: A graph showing the seconds of delay for each run from the last week.
Minimum, Maximum, Mean, Median: Quick stats to see the extremes and the “typical” lag over the last month.
Hourly Patterns: Notice if certain times of day or days of the week are more prone to delays.
How it works
An hourly cron job on GitHub Actions measures the actual start time versus the expected schedule. It pulls this data from the GitHub API and updates the dashboard continuously. That way, you get a live view of how reliable your cron jobs really are.
Why it exists
I made this because I got tired of guessing when GitHub cron jobs would actually run. It’s built with open data, open dashboards, and open coffee tabs. Not affiliated with GitHub.
Check it out, poke around, and plan your CI/CD pipelines with real numbers instead of guesswork. Especially useful when planning for late-night software releases!
👉View the dashboard & the repository lowlydba/cron-drift
If you’re interested in novel ways to optimize your CI/CD pipelines, check out my other article:
